
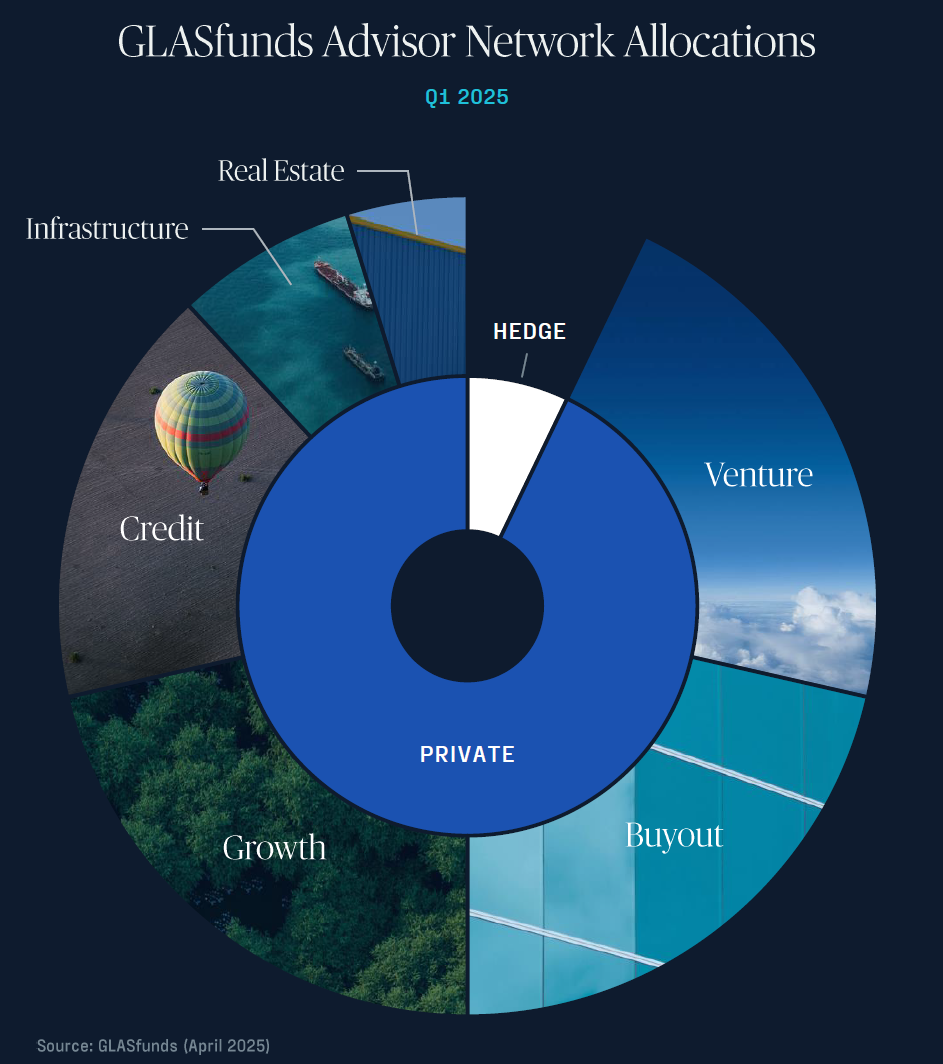
Allocations continue to flow to private capital
Private markets remained active last quarter, with capital flowing steadily into buyout, growth, and credit strategies despite a more cautious underwriting environment. Large-scale vehicles targeting middle and upper-middle market buyouts attracted significant allocations, reflecting continued client confidence in established platforms. At the same time, growth equity and GP stakes strategies drew notable attention, particularly those focused on acquiring long-term minority positions in asset managers—a trend driven by clients’ increasing appetite for stable, cash-flowing exposures amid economic uncertainty.
In private credit, allocation momentum continued across opportunistic and special situations strategies. This suggests clients are positioning to capture complexity premiums in today’s competitive environment. Niche areas like CLOs and credit secondaries also gained traction, pointing to a broader effort to access less competitive areas of the market.
Venture fundraising showed resilience, even in the face of valuation resets and exit delays. Early-stage funds targeting innovation in AI, enterprise tech, healthcare, and infrastructure themes continued to close capital, as did late-stage vehicles seeking to capitalize on maturing companies still priced below prior peaks. Co-investment structures also made an appearance, underscoring the growing demand for flexible, targeted exposure in this part of the market.
Overall takeaway:
Advisors are staying selective, but capital is moving with purpose—into managers, strategies, and structures that offer real differentiation. In a cycle marked by slower exits and more complex deal dynamics, investor focus is shifting toward vintage quality, downside protection, and creativity in sourcing. Core sectors still draw capital, but the edge is increasingly found at the intersection of specialization and structure.
Private equity
Emerging from the Fog
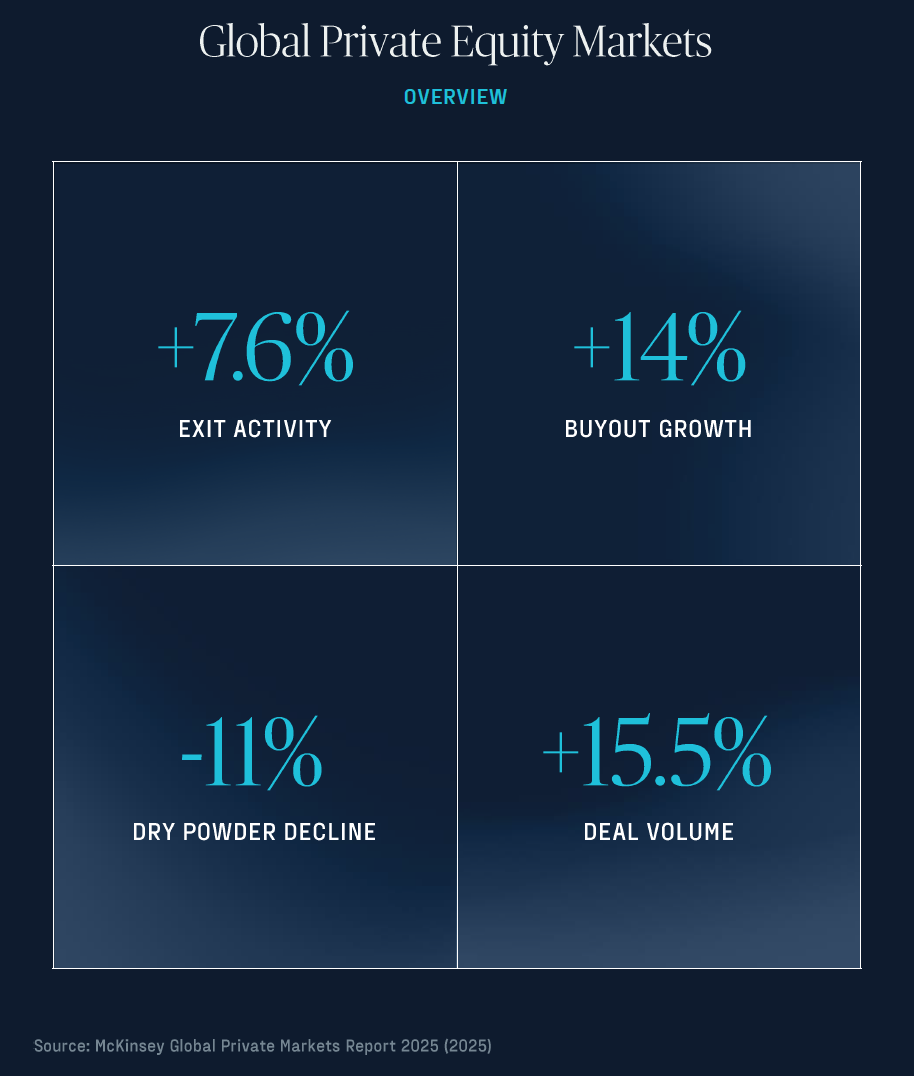
2024 saw private equity (PE) shake off its slump with global deal volume rebounding ~14% to about $2 trillion – making it the third-most-active year on record.
Exit activity picked up as well, and for the first time since 2015, cash distributions back to limited partners exceeded new capital calls. This revival comes after a period in which even sage observers described the environment as “meh,” with PE returns lagging public markets and few exits to celebrate.
Now the fog is lifting in a recent survey, 30% of investors plan to increase their PE allocations in the next 12 months. However, the survey was conducted before the recent volatility due to changing trade policies. Early indications suggest falling deal activity disappointing expectations post-election of gains due to lower regulations and more business friendly conditions.
Secondaries
GP-Led Secondaries Surge as Sponsors Hold Winners
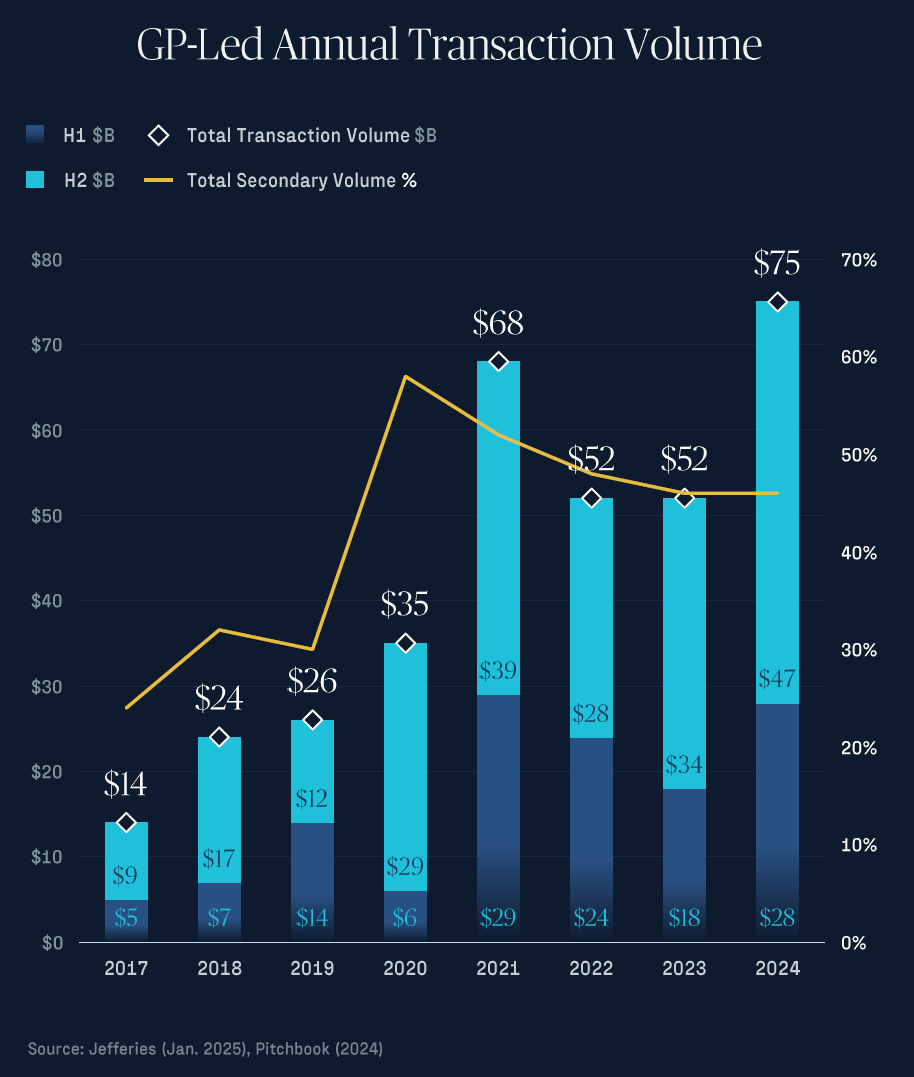
GP-led secondaries reached $75 billion in 2024, a 44% year-over-year increase, as sponsor-led solutions continue to gain mainstream acceptance. The market was dominated by single-asset continuation funds, which accounted for over 60% of GP-led volume—a clear signal that sponsors are increasingly opting to hold their top-performing assets longer rather than exit under less favorable market conditions. Notably, pricing in GP-led deals remains strong, with high-quality sponsors transacting at or near NAV. Looking ahead, the category is expected to grow further, with GP-led secondaries projected to surpass $85 billion in 2025, driven by broader adoption and increased confidence in the structure across the private equity landscape.
Over the past decade, the secondary market has experienced significant growth, with a compound annual growth rate (CAGR) of approximately 10-12%. GP-led transactions have been a key driver of this growth, although they are somewhat constrained by buy-side capital as investors continue to catch up with capital deployment.
private credit
Defaults Diverge, Complexity Grows
There continues to be divergence within the broadly syndicate loan market and across BSLs and private credit structures. Sponsors borrowing in the BSL market are increasingly turning to Liability Management Exercises (LMEs) to avoid outright defaults and extend liquidity. These “soft defaults” surged to a 20-month high in December 2024, as companies faced mounting pressure to restructure. While hard defaults—missed payments—have trended lower, 35% of 2024’s defaults were repeat offenders, the highest on record per JP Morgan. That strain is showing up in the data: 686 U.S. companies filed for bankruptcy in 2024, up 8% from 2023 and the highest total since 2010, according to S&P. The pressure is particularly acute in the leveraged loan market, where floating-rate debt and weak covenants leave borrowers exposed.
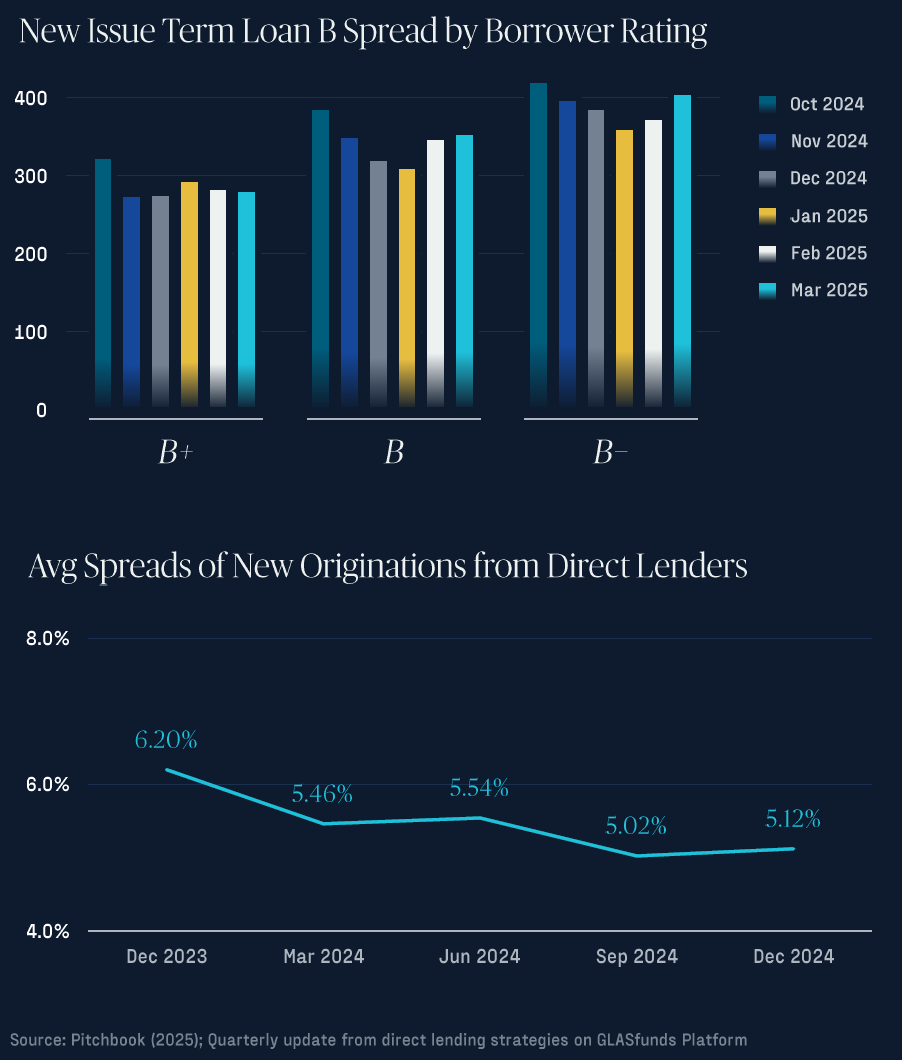
Interestingly, despite rising credit stress, new-issue loan spreads have shown signs of stabilization. For example, B-rated issuers have priced loans around 350–360bps over base rates through Q1 2025, down from peak levels in mid-2024. However, B– rated borrowers saw spreads climb above 400bps in March 2025, reflecting persistent investor caution around lower-quality credits. This divergence underscores how LMEs and other restructuring tools are quietly reshaping the credit landscape—offering selective opportunity but requiring real underwriting discipline.
Looking ahead, the market is divided on the path for LME activity in 2025. According to PitchBook LCD, 34% of market participants expect LME activity to remain steady, while 31% believe it will moderately increase. A smaller group (24%) forecasts a moderate decrease, indicating that, while the LME wave may plateau, it’s far from over. Sponsors continue to favor LMEs as a tool to buy time, especially when full-blown defaults would force asset fire sales or damage enterprise value. While direct lending has largely avoided LMEs it could be only a matter of time with continued blurring between the BSL market and private credit. However, we believe high quality, experienced direct lending managers will be able to navigate changes in restructuring processes and deliver compelling returns to investors.
Spreads for middle-market to upper-middle direct lending compressed during 2024. While data is still being reported, conversations with lenders suggest spreads in 1Q 2025 were mostly flat compared to 4Q 2025. Compressing spreads and continued strong fund raising for evergreen vehicles suggest continued borrower friendly conditions. Uncertainty from trade policy has curtailed deal activity from PE sponsor, lowering demand for capital. While, higher quality underwriters will be able to generate all-weather returns in our view, be believe there more favorable conditions in other areas in private credit such as real estate lending, securitized assets and niche industries such as Cannabis.
Cannabis Lending in Focus
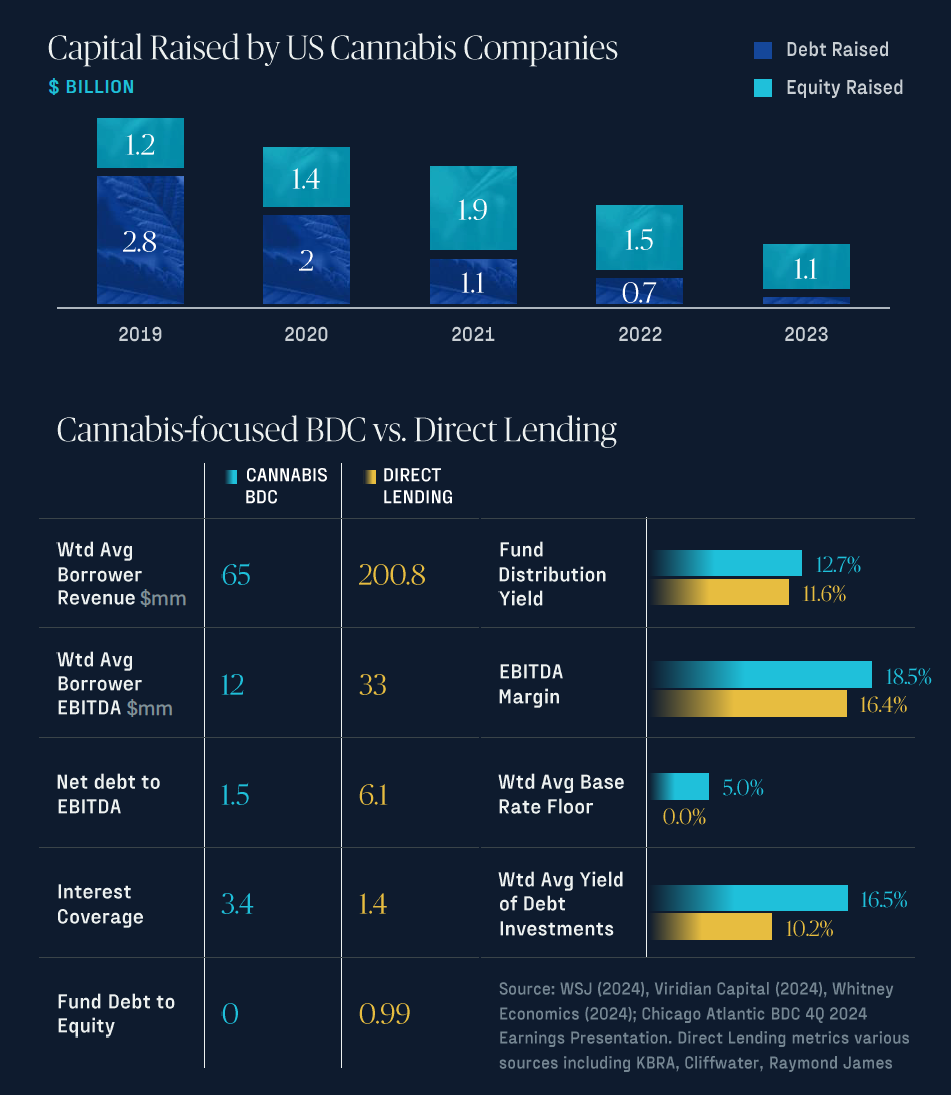
The U.S. cannabis industry has always operated in a financial gray zone. With federal prohibition keeping traditional banks and institutional investors on the sidelines, early cannabis operators turned to equity raises and sale-leasebacks to fund growth. But as public market enthusiasm cooled and equity valuations collapsed post-2019, the industry’s financing model underwent a dramatic shift. In 2019 alone, cannabis companies raised roughly $2.8 billion in equity—but by 2024, that number plummeted to just $100 million, marking a 95% drop [WSJ 2024]. In contrast, debt capital has remained resilient and is now the dominant funding source, with over 92% of the $1.2 billion raised in 2024 coming from private credit [WSJ 2024].
Today, private lenders have become the industry’s financial backbone, offering asset-backed loans with interest rates often ranging from 12–20%—a risk premium that reflects the lack of bankruptcy protection, the burden of IRS Code 280E, and the enforcement hurdles around collateral [Investopedia 2024].
But cracks are starting to show. With over $2.5 billion in cannabis debt maturing by 2026 [WSJ 2024] and wholesale prices declining —now averaging $955 per pound, less than half of 2015’s peak of $2,133 [WSJ 2024]—operators are under immense pressure. Defaults are rising, consolidation is accelerating, and lenders are tightening their terms.
However, sentiment may be pessimistic compared to conditions. Some scaled, multi-state operators (MSOs) have been able to navigate market conditions, generate attractive growth and improve profitability. Even well-performing cannabis companies lack access to capital compared to similar sized non-cannabis companies. U.S. legal cannabis sales are projected to reach $31.4 billion in 2024, a $2.6 billion increase from the previous year [Whitney Economics 2024]. The US market is projected to grow 7% per year to $45B in 2028 [BDSA Analytics] If anticipated federal reforms like SAFE Banking or cannabis rescheduling come to pass, this high-risk, high-yield corner of private credit could see a surge in liquidity and a repricing of risk. Until then, the cannabis lending market remains a frontier—volatile, regulation-bound, but rich with opportunity for those who know where to look.
Real assets
Real Estate vs. Infrastructure: Rate Pressures & Resilience
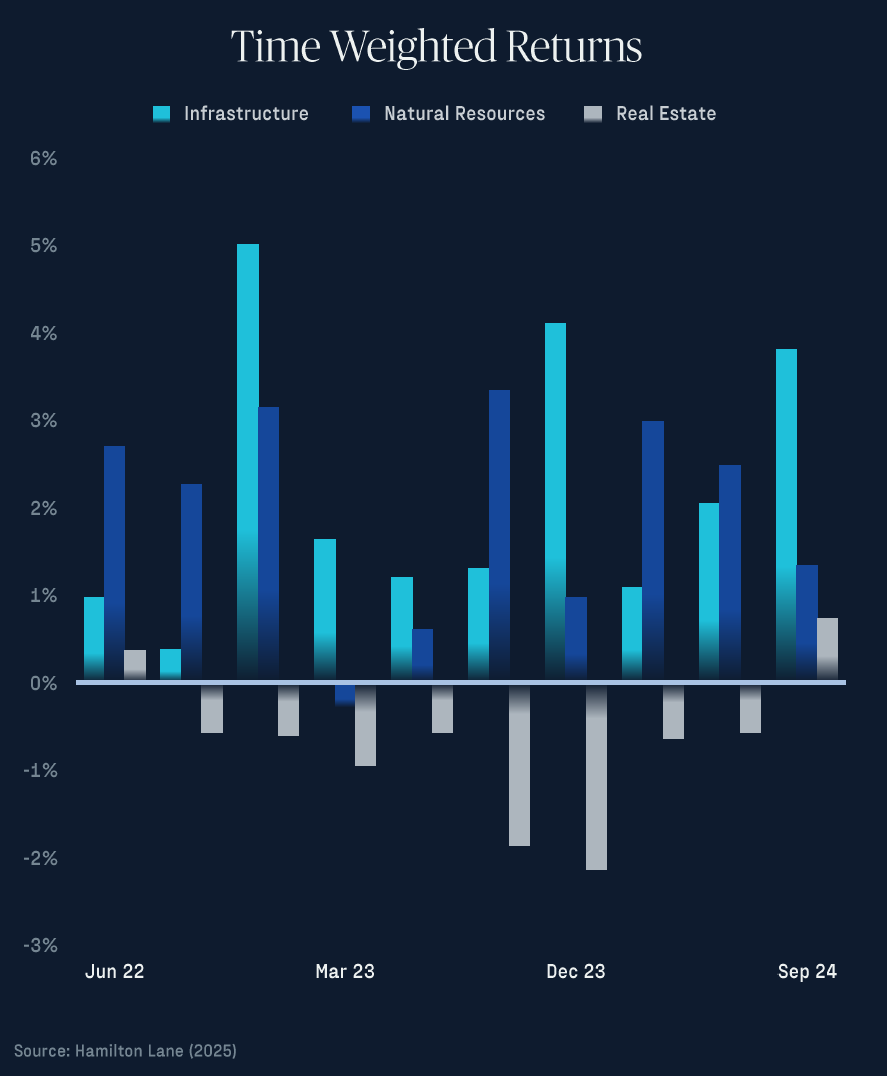
It has been a tale of two trajectories in the real assets world. Private real estate funds struggled in the high-rate environment – declining eight straight quarters before registering a gain in 3Q 2024. Surging interest rates drove up cap rates and made price discovery difficult, choking off deal volume and even forcing many core real estate investors to seek liquidity from open-end funds (indeed, redemption requests hit two-decade highs).
By contrast, infrastructure fared better: even with fundraising slowing to the lowest level in a decade, private infrastructure funds still delivered modest positive returns (~3–4% in 2023) and continue to benefit from steady cash flows. Looking ahead, there are reasons for optimism. Industry data show many real estate valuations may be nearing a bottom, setting the stage for selective opportunities once the market finds its footing. And in infrastructure, institutional investors remain bullish – a slew of new mega-funds (each $10B+) launched fundraising in late 2024 to capitalize on the long-term demand for infrastructure investments.
A Spotlight on Workforce Housing
On April 2, 2025, President Trump unveiled a sweeping new trade policy: a universal 10% tariff increase (in percentage points) on all imports, along with reciprocal tariffs for countries in which the US has a large goods deficit with. On April 9th, reciprocal tariffs for most countries were delayed with China being a notable exception. The cumulative tariff rate on China is currently 30% but could increase to 145% in August if there are no additional temporary or long-term agreements reached by then.
For developers, this policy change lands in the middle of budget season and hits especially hard for sectors like workforce housing, where margins are already tight. One manager noted that their typical unit includes $10,000 worth of materials from China, and a full 10% tariff would add $1,000 per unit, slicing about 4 basis points off the unlevered yield. The manager also noted that there are not an other viable sourcing channels for certain materials other than factories in China. While not catastrophic, it’s another incremental pressure point in a cost stack already challenged by interest rates, labor shortages, and zoning delays.
The good news is that many experienced developers already front-load material procurement to hedge against volatility. And, as we saw during the prior Trump administration, a meaningful portion of past tariffs were absorbed by suppliers or offset by currency shifts—so actual pass-through may be lower than advertised. Still, the message is clear: even domestic-facing sectors like housing development aren’t insulated from global politics. Expect sourcing strategies, contract pricing, and schedule buffers to become more critical as trade tensions ripple through the supply chain.
the new money
Retail Investors Storm Private Markets
An intriguing shift is underway in who provides capital for private investments. Historically, private markets were the playground of institutions – pensions, endowments, sovereign funds. Now, non-institutional capital is taking on a bigger role. High-net-worth individuals and affluent retail investors are increasingly accessing private equity and credit funds (often through feeder funds and wealth managers), and general partners are eagerly courting this money.
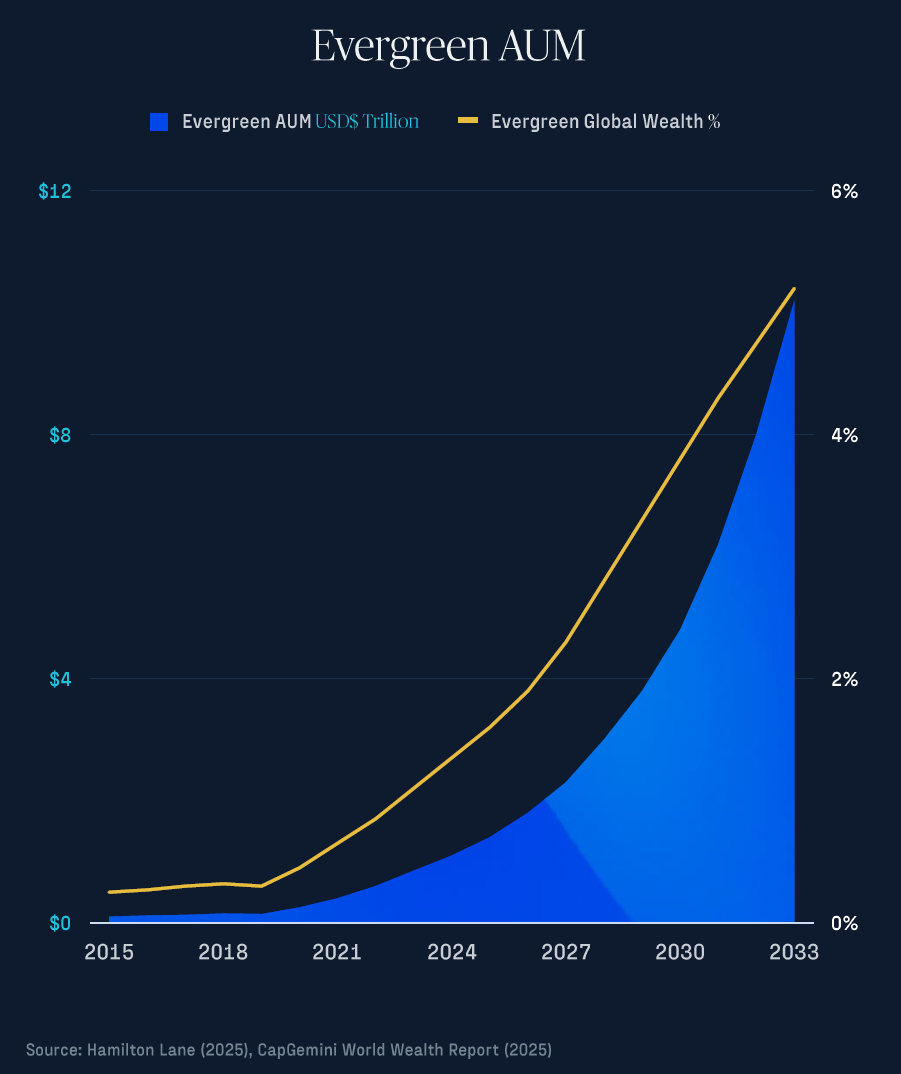
One notable trend reshaping the private capital landscape is the rapid rise of “evergreen” funds—semi-liquid, open-ended vehicles designed primarily for individual investors. These funds have already amassed around $700 billion in assets, accounting for roughly 5% of the private market, and some estimates suggest they could quadruple to represent 20% of total AUM within the next decade.
But with that growth comes tradeoffs. Evergreen funds deploy capital continuously at NAV, which can create a constant pressure to invest—regardless of market conditions.
In an environment flush with capital but light on deals, this structure may contribute to looser underwriting standards and compressed alpha across the ecosystem. As more capital chases fewer high-quality assets, GPs may face tough choices: maintain discipline and risk dry powder drag, or lean into deals that might not have cleared in more selective vintages.
This retailization of private markets is big news. It means new fund structures, broader access, and capital flowing in from a completely different type of LP. For investors, it opens (cautious) access to strategies once reserved for pensions and endowments. For GPs, it offers a chance to diversify their fundraising base and build recurring capital flows.
Make no mistake: the retail wave is still in its early innings. But as more capital enters the system through evergreen structures, preserving alpha will require even greater selectivity, governance, and alignment than in the past.
intended solely for financial institutions and investment professionals
GLASfunds, LLC is a registered investment adviser under the Investment Advisers Act of 1940, as amended. Registration does not imply any specific level of skill or expertise. This information is intended solely for financial institutions and investment professionals and is not directed at individual consumers or retail investors unless explicitly noted.
The opinions expressed herein are for informational purposes only and should not be construed as specific advice or recommendations regarding any security or advisory service. The content is intended to provide educational insights about the financial industry. The views shared in this commentary are subject to change at any time without notice. Although all information presented, including that from external, linked, or independent sources, is believed to be reliable, we make no guarantee as to its accuracy or completeness. We reserve the right to modify these materials without notice and are under no obligation to provide updates.
This document may contain “forward-looking statements,” identifiable by terms such as “believe,” “expect,” “anticipate,” “should,” “planned,” “estimated,” “potential,” and other similar expressions. Examples include, but are not limited to, projections about financial conditions, operational results, and the performance of investment strategies. These statements are subject to various risks and uncertainties, including, but not limited to, general and local economic conditions, changing competition within specific industries and markets, fluctuations in interest rates, changes in legislation or regulation, and other economic, competitive, governmental, regulatory, and technological factors that could cause actual results to differ significantly from those projected.
This report is not intended to be, nor should it be construed as, an invitation, inducement, offer or solicitation to engage in any investment activity. Nothing contained in this report constitutes any tax nor legal advice. This report is solely for the intended recipient, who has warranted qualifications to make sophisticated investment decisions. GLASfunds makes no representations or warranties regarding the methodology used for any investment performance calculations presented by any funds. Past performance is not indicative of future returns.
